
In today’s digital landscape, cloud hosting has become essential for businesses of all sizes. Understanding how to effectively monitor performance in your cloud hosting environment is crucial for ensuring optimal website speed, application responsiveness, and overall user experience. This comprehensive guide will delve into the key metrics and tools you need to effectively monitor performance in cloud hosting, empowering you to identify and address potential bottlenecks before they impact your bottom line. Whether you’re using AWS, Google Cloud, Azure, or another cloud hosting provider, the principles and techniques discussed here will be invaluable for maintaining peak performance.
Monitoring your cloud hosting performance is not a one-time task, but rather an ongoing process that requires vigilance and the right tools. From understanding basic metrics like CPU usage, memory utilization, and network latency, to utilizing advanced monitoring solutions, proactive performance monitoring can prevent costly downtime, improve resource allocation, and enhance the overall stability and scalability of your applications. This article will equip you with the knowledge and strategies you need to establish a robust cloud hosting performance monitoring system, ensuring your applications consistently deliver optimal performance for your users.
Importance of Performance Monitoring
Performance monitoring plays a critical role in maintaining the health and efficiency of your cloud hosting environment. It provides essential insights into the behavior of your applications and infrastructure, allowing you to identify and address potential bottlenecks before they impact users.
Proactive monitoring enables you to anticipate and mitigate performance issues, ensuring a seamless user experience. By tracking key metrics, you can optimize resource allocation, improve application responsiveness, and ultimately, increase customer satisfaction.
Metrics You Should Track
Monitoring cloud hosting performance involves tracking key metrics to ensure optimal website functionality and user experience. Uptime is critical, reflecting the percentage of time your server is operational. Response time measures how quickly your server responds to requests, directly impacting user satisfaction. Resource utilization, including CPU, memory, and disk I/O, helps identify potential bottlenecks.
Bandwidth consumption tracks data transfer volume, which is crucial for managing costs and preventing overcharges. Error rates, such as HTTP error codes, highlight issues requiring immediate attention. Finally, database performance metrics, like query response time, ensure efficient data retrieval.
CPU and Memory Utilization
CPU utilization is a key metric indicating the percentage of time your CPU is actively processing tasks. High CPU utilization, consistently above 80%, often suggests resource constraints and potential performance bottlenecks. This could indicate a need for vertical scaling (more powerful server) or code optimization.
Memory utilization measures the portion of your server’s RAM actively in use. Like CPU, consistently high memory utilization can lead to performance degradation and application instability. Exceeding available memory can trigger swapping to disk, significantly impacting performance. Addressing high memory utilization might involve vertical scaling or optimizing application memory usage.
Bandwidth and Latency Monitoring
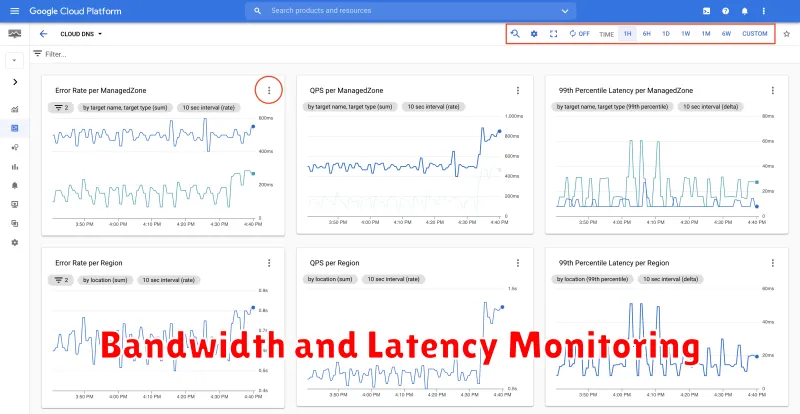
Bandwidth monitoring tracks the amount of data transferred in and out of your cloud server. High bandwidth consumption can indicate unexpected traffic spikes, potential DDoS attacks, or simply an application requiring more resources than allocated. Consistently exceeding bandwidth limitations can result in throttling or overage charges.
Latency, often referred to as ping, measures the time it takes for data to travel between your server and a user. High latency leads to slow loading times and a poor user experience. Monitoring latency helps identify network bottlenecks, server-side issues, or problems with specific geographic locations.
Application-Level Performance
Application-level performance monitoring focuses on the performance of your software itself. This includes metrics like response times, error rates, and request throughput. It helps identify bottlenecks and optimize code for efficiency.
Key metrics to consider include:
- Response Time: How long it takes for your application to respond to a request.
- Error Rate: The percentage of requests that result in errors.
- Request Throughput: The number of requests your application can handle per unit of time.
Tools like application performance monitoring (APM) solutions provide deep insights into application behavior, allowing for detailed analysis and optimization.
Using Provider’s Native Tools
Leveraging your cloud provider’s native monitoring tools is a crucial first step in understanding your application’s performance. These tools are often deeply integrated with the platform and provide valuable insights into resource utilization.
Most providers offer dashboards displaying key metrics such as CPU usage, memory consumption, network traffic, and disk I/O. These dashboards allow for quick identification of performance bottlenecks. Familiarize yourself with the specific tools offered by your provider (e.g., AWS CloudWatch, Azure Monitor, Google Cloud Monitoring) to effectively utilize their capabilities.
These tools often include features such as alerting and automated scaling, allowing you to proactively address performance issues and maintain optimal resource allocation.
Integrating Third-Party Monitors
While cloud providers offer built-in monitoring tools, integrating third-party monitors can provide enhanced visibility and specialized functionalities. These tools often offer more granular control, advanced analytics, and customizable dashboards.
Third-party monitoring solutions can be categorized into:
- Infrastructure Monitoring: Focuses on server health, network performance, and resource utilization.
- Application Performance Monitoring (APM): Provides insights into application behavior, transaction tracing, and error detection.
- Digital Experience Monitoring (DEM): Measures user experience and website performance from various geographic locations.
Choosing the right tool depends on your specific monitoring needs and the complexity of your cloud infrastructure. Integration typically involves installing agents, configuring APIs, and setting up dashboards.
Setting Alerts and Thresholds
Setting up proper alerts and thresholds is crucial for proactive performance monitoring. This allows you to be notified of potential issues before they impact users. Alerts are notifications triggered when a specific metric crosses a predefined threshold.
Define thresholds based on your application’s performance requirements. For example, you might set a threshold for CPU utilization at 80%. If CPU usage surpasses this limit, an alert is triggered, informing you of the potential overload.
Common metrics to monitor include CPU usage, memory utilization, disk I/O, and network latency. Fine-tune these thresholds over time to avoid unnecessary alerts while ensuring critical issues are promptly addressed.
Performance Benchmarking
Performance benchmarking is a critical aspect of monitoring cloud hosting performance. It involves establishing a baseline performance measurement and comparing current performance against this baseline. This helps identify performance deviations and potential bottlenecks.
Benchmarking can involve various tests, including load testing to simulate user traffic, stress testing to determine system breaking points, and endurance testing to evaluate sustained performance over time.
Choosing the right metrics is essential for effective benchmarking. Key metrics often include response time, throughput, error rate, and resource utilization (CPU, memory, disk I/O).
Ongoing Optimization
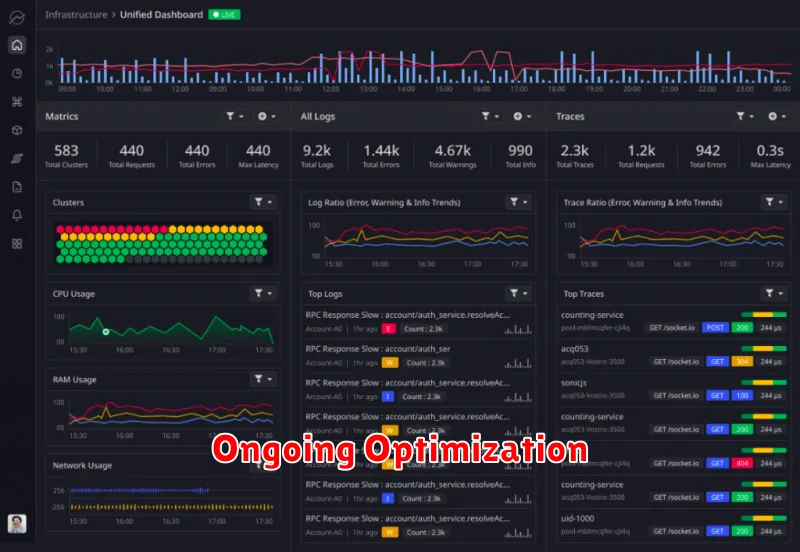
Performance monitoring isn’t a one-time task. Cloud environments are dynamic, and optimization is an ongoing process. Regular reviews of your monitoring data are crucial. This allows you to identify trends, anticipate potential issues, and adapt to changing demands.
Key areas for ongoing optimization include resource allocation, database performance, and application code. Regularly evaluate if your allocated resources still align with your needs. Analyze database queries for slowdowns and optimize them for efficiency. Continuously profile your application code to pinpoint and address performance bottlenecks.